
Data handling using pandas 1 ncert solutions pdf download
Chapter 2: Data Handling Using Pandas – I
Data handling using pandas 1 ncert solutions pdf download Audio Notes 1
Pandas से Data Handle करना सीखो — एकदम आसान तरीके से! Natural Classroom Story Notes | Hindi + British English | CBSE Board
Classroom Notes | Hindi + English | CBSE Board
क्या आप Class 12 Informatics Practices (IP) के छात्र हैं और Data Handling Using Pandas 1 ncert Solutions की तलाश कर रहे हैं? अक्सर कोडिंग और डेटा को समझना थोड़ा मुश्किल लगता है, लेकिन अगर इसे एक कहानी की तरह पढ़ा जाए, तो सब कुछ आसान हो जाता है।
इस पोस्ट में, हम Data handling using pandas को रटने के बजाय, उसे क्लासरूम की एक मजेदार चर्चा के जरिए समझेंगे। चाहे आप Data handling using pandas 1 ncert solutions English pdf download करना चाहते हों या Hindi pdf download, यहाँ आपको सब कुछ एक ही जगह मिलेगा।
चलिए, क्लास में चलते हैं जहाँ Sir आज एक बहुत ही ‘Friendly’ लाइब्रेरी — Pandas से सबका परिचय करवाने वाले हैं!
2.1 — Python Libraries क्या होती हैं?
Sir class में आए और सीधे बोर्ड पर तीन नाम लिख दिए — NumPy, Pandas, Matplotlib।
फिर मुस्कुराते हुए पूछा,
Sir: Sir: “बच्चों, बोर्ड एग्जाम के लिए Data handling using pandas 1 ncert solutions बहुत महत्वपूर्ण हैं। अक्सर छात्र सिर्फ कोड रटते हैं, लेकिन अगर तुम लॉजिक समझ गए तो PDF ढूंढने की ज़रूरत नहीं पड़ेगी, तुम खुद नोट्स बना लोगे!”
बताओ, Python में हम हर बार सब कुछ खुद से लिखते रहें? या कुछ ready-made tools इस्तेमाल करें तो बेहतर नहीं होगा?
Rahul ने तुरंत हाथ उठाया और बोला,
Rahul: Sir, ready-made tools हों तो हमारा बहुत time बच जाएगा ना?
Sir ने हँसते हुए कहा, “Exactly! बहुत अच्छा जवाब।”
Sir: देखो, Python में हजारों developers रोज़ काम करते हैं। उनमें से बहुत से लोग एक ही तरह के काम बार-बार करते हैं — जैसे arrays बनाना, data को organize करना, graphs बनाना वगैरह।
तो उन्होंने सोचा कि क्यों न इन common tasks को पहले से ही बना के रखा जाए, ताकि बाकी लोग बार-बार कोड न लिखें।
इसी को हम Python Libraries कहते हैं।
Library मतलब — पहले से तैयार किए गए functions और tools का collection, जिसे हम अपनी Python program में आसानी से import करके इस्तेमाल कर सकते हैं।
Sir बोले, “जैसे किताबों की library में तुम्हें हर किताब खुद लिखनी नहीं पड़ती, बस उधार ले लेते हो। वैसे ही Python libraries में भी functions पहले से ready होते हैं।”
Class में कुछ और सवाल हुए:
- Neha: Sir, तो हम कितने libraries इस्तेमाल कर सकते हैं?
- Sir: जितनी चाहो! Python में लाखों libraries उपलब्ध हैं। लेकिन Data Science और Data Handling के लिए तीन libraries सबसे important हैं:
- NumPy → Numerical calculations और arrays के लिए
- Pandas → Data को आसानी से handle और analyze करने के लिए (जो हम इस chapter में पढ़ेंगे)
- Matplotlib → Graphs और charts बनाने के लिए
Sir ने बोर्ड पर लिखा:
Python Libraries = Time savers + Ready-made, powerful tools
फिर मुस्कुराते हुए बोले, “आज से हम Pandas के साथ दोस्ती करेंगे। ये library data handling को इतना आसान बना देती है कि तुम खुद हैरान रह जाओगे!”
|
Sir: Bilkul! यही काम करती हैं Python Libraries. ये basically collection होती है built-in modules की — जिनमें पहले से बहुत सारे functions लिखे हुए हैं। हम directly use करो, अपना काम हो जाए। |
Data handling using pandas 1 ncert solutions pdf download Audio Notes 2
तो तीन main libraries हैं जो हम इस chapter में समझेंगे —
- NumPy — Numerical Python. Class 11 में पढ़ चुके हो। Multidimensional arrays के लिए। — For numerical array-based data manipulation
- Pandas — Panel Data. Data analysis और manipulation के लिए। बहुत powerful tool है। — For tabular data — like a spreadsheet in Python
- Matplotlib — graphs और charts बनाने के लिए। Pandas और NumPy के साथ मिलकर काम करती है। — For data visualisation — plots, bar charts, etc.
Sir ने board पर Pandas vs NumPy लिख दिया। कोई student बोला —
|
Priya: Sir, NumPy तो already है ना data analysis के लिए — तो Pandas की जरूरत क्यों? (genuine confusion |
|
Sir: Good question, Priya! Hmm… देखो — NumPy को homogeneous data चाहिए, मतलब सब values एक ही type की। लेकिन Pandas DataFrame में अलग-अलग types हो सकती हैं — int, float, string, datetime — सब एक साथ। Plus, Pandas में column names होते हैं, जिससे data track करना बहुत आसान हो जाता है। |
|
Pandas install करने के लिए command है: pip install pandas (Python already installed हो तो ही यह काम करेगा) |
How to Install Pandas in Python (Very Easy Method)
Step 1: Open Command Prompt
First, open Command Prompt on your computer.
- Press Windows + R
- Type cmd
- Press Enter
Command Prompt will open.
Step 2: Type This Simple Command
Now type this command:
Then press Enter
Step 3: Wait for Installation
- Python will download Pandas
- It may take 1–2 minutes
- After finishing, you will see Successfully installed pandas
That means Pandas is installed ✅
Step 4: Check if Pandas is Installed or Not
Open Python and type:
print(“Pandas installed successfully”)
If no error comes, then Pandas is installed successfully 🎉
Very Short Method (Only One Command)
Just type this:
Rahul ने तुरंत हाथ उठाया और बोला,
Rahul: Sir, ready-made tools हों तो हमारा बहुत time बच जाएगा ना?
Sir ने हँसते हुए कहा, “Exactly! बहुत अच्छा जवाब।”
Sir: देखो, Python में हजारों developers रोज़ काम करते हैं। उनमें से बहुत से लोग एक ही तरह के काम बार-बार करते हैं — जैसे arrays बनाना, data को organize करना, graphs बनाना वगैरह।
तो उन्होंने सोचा कि क्यों न इन common tasks को पहले से ही बना के रखा जाए, ताकि बाकी लोग बार-बार कोड न लिखें।
इसी को हम Python Libraries कहते हैं।
Library मतलब — पहले से तैयार किए गए functions और tools का collection, जिसे हम अपनी Python program में आसानी से import करके इस्तेमाल कर सकते हैं।
Sir बोले, “जैसे किताबों की library में तुम्हें हर किताब खुद लिखनी नहीं पड़ती, बस उधार ले लेते हो। वैसे ही Python libraries में भी functions पहले से ready होते हैं।”
Class में कुछ और सवाल हुए:
- Neha: Sir, तो हम कितने libraries इस्तेमाल कर सकते हैं?
- Sir: जितनी चाहो! Python में लाखों libraries उपलब्ध हैं। लेकिन Data Science और Data Handling के लिए तीन libraries सबसे important हैं:
- NumPy → Numerical calculations और arrays के लिए
- Pandas → Data को आसानी से handle और analyze करने के लिए (जो हम इस chapter में पढ़ेंगे)
- Matplotlib → Graphs और charts बनाने के लिए
Sir ने बोर्ड पर लिखा:
Python Libraries = Time savers + Ready-made, powerful tools
फिर मुस्कुराते हुए बोले, “आज से हम Pandas के साथ दोस्ती करेंगे। ये library data handling को इतना आसान बना देती है कि तुम खुद हैरान रह जाओगे!”
ये version एकदम natural classroom feel देता है, जैसे कोई अच्छा teacher या senior student notes बना रहा हो। चाहिए तो आगे के sections भी इसी स्टाइल में rewrite कर दूँ!
2.2 — Series
1D array — values + index
Sir ने board पर लिखा —
|
Sir: Series एक one-dimensional array है जिसमें किसी भी type की values हो सकती हैं — int, float, string, list… By default index 0 से start होता है। लेकिन हम अपना custom index भी दे सकते हैं। |
Board पर example दिखाया — Student names की Series:
|
Index |
Value |
|---|---|
|
0 |
Arnab |
|
1 |
Samridhi |
|
2 |
Ramit |
|
3 |
Divyam |
|
4 |
Kritika |
अब Sir ने code type करना शुरू किया —
|
Sir: Pandas use करने से पहले हमेशा import करना पड़ता है। और हम इसे ‘pd’ alias देते हैं — यह convention है, mandatory नहीं, but everyone does it. |
|
Amit: Sir, pd की जगह कुछ और भी दे सकते हैं? |
|
Sir (gently): हाँ दे सकते हो — technically कोई भी name दे सकते हो। लेकिन ‘pd’ standard है, सब इसी को use करते हैं। अगर अलग दोगे तो code पढ़ने वाले को confuse होगा। So stick to PD! |
[ Amit nods, slightly embarrassed, but got the point ]
(A) Scalar values से Series बनाना —
|
>>> import pandas as pd # Pandas import with alias pd >>> series1 = pd.Series([10, 20, 30]) # Create a Series >>> print(series1) # Display the series |
|
Output: 0 10 1 20 2 30 dtype: int64 |
|
Sir: देखो — output में दो columns हैं। Left side है index (0,1,2 — default) और right side है actual value. Simple! |
Custom index भी दे सकते हैं —
|
>>> series2 = pd.Series([‘Kavi’,’Shyam’,’Ravi’], index=[3,5,1]) >>> print(series2) |
|
Output: 3 Kavi 5 Shyam 1 Ravi dtype: object |
|
>>> series2 = pd.Series([2,3,4], index=[‘Feb’,’Mar’,’Apr’]) >>> print(series2) |
|
Output: Feb 2 Mar 3 Apr 4 dtype: int64 |
(B) NumPy Array से Series —
|
>>> import numpy as np >>> import pandas as pd >>> array1 = np.array([1,2,3,4]) >>> series3 = pd.Series(array1) >>> print(series3) |
|
Output: 0 1 1 2 2 3 3 4 dtype: int32 |
|
Sir: Array की length और index की length same होनी चाहिए — वरना ValueError आएगी। याद रखो! |
(C) Dictionary से Series — Sir ने explain किया:
|
Sir: Dictionary में key-value pairs होते हैं। जब हम dictionary से Series बनाते हैं, तो keys बन जाती हैं index और values बन जाती हैं Series की values. |
|
>>> dict1 = {‘India’:’NewDelhi’, ‘UK’:’London’, ‘Japan’:’Tokyo’} >>> series8 = pd.Series(dict1) >>> print(series8) |
|
Output: India NewDelhi UK London Japan Tokyo dtype: object |
🔍 2.2.2 — Series के Elements Access करना
Indexing और Slicing
Sir ने पूछा — ‘अच्छा बताओ, अगर series से कोई particular value निकालनी हो, तो?’
|
Neha: Sir, index use करते हैं? |
|
Sir: Correct Neha! और index दो type का होता है — |
- Positional Index — 0, 1, 2… जैसे NumPy arrays में। — Starts from 0 by default
- Labelled Index — जो हमने खुद assign किया हो, जैसे ‘Feb’, ‘Mar’ या ‘India’. — User-defined labels
(A) Indexing —
|
>>> seriesNum = pd.Series([10,20,30]) >>> seriesNum[2] 30 |
|
>>> seriesCapCntry = pd.Series([‘NewDelhi’,’WashingtonDC’,’London’,’Paris’], index=[‘India’,’USA’,’UK’,’France’]) >>> seriesCapCntry[‘India’] ‘NewDelhi’ >>> seriesCapCntry[1] # positional index ‘WashingtonDC’ |
Multiple elements access करना —
|
>>> seriesCapCntry[[3,2]] France Paris UK London dtype: object |
(B) Slicing —
|
Sir: Slicing में [start:end] देते हैं — लेकिन ध्यान रखो, positional index में end position exclude होती है। Labelled index में end label include होती है — यह difference important है! |
[ *few students look confused* 🤔 ]
|
Riya: Sir, मतलब labelled slicing में last wala bhi aata hai? |
|
Sir: Haan! यह NumPy से अलग है Pandas का behavior. Positional slice में end exclude, label slice में end include. Try करके देखो — समझ आएगा. |
|
>>> seriesCapCntry[1:3] # positional — excludes index 3 USA WashingtonDC UK London >>> seriesCapCntry[‘USA’:’France’] # labelled — includes France USA WashingtonDC UK London France Paris >>> seriesCapCntry[::-1] # reverse order France Paris UK London USA WashingtonDC India NewDelhi |
Data handling using pandas 1 ncert solutions pdf download Audio Notes 3
2.2.3 — Series के Attributes
Properties जो हम access कर सकते हैं
Sir ने Table 2.1 board पर draw की —
|
Attribute |
क्या करता है |
Example |
|---|---|---|
|
.name |
Series को name assign / print करता है |
seriesCapCntry.name |
|
.index |
Index को name देता है |
seriesCapCntry.index |
|
.values |
Series की सारी values list में |
seriesCapCntry.values |
|
.size |
Total कितनी values हैं |
seriesCapCntry.size → 4 |
|
.empty |
Series empty है? True/False |
seriesEmpty.empty → True |
⚙️ 2.2.4 — Methods of Series
head(), tail(), count()
Sir ने methods का table लिखवाया —
|
Method |
क्या करता है |
Default value |
|---|---|---|
|
head(n) |
Series के पहले n values दिखाता है |
Default n=5 |
|
tail(n) |
Series के आखिरी n values दिखाता है |
Default n=5 |
|
count() |
Non-NaN values की count देता है |
— |
➕ 2.2.5 — Mathematical Operations on Series
जोड़, घटाव, गुणा, भाग — and NaN
|
Sir: Class 11 में NumPy arrays पर math operations किए थे। Pandas में भी same तरीके से होता है — element-wise. लेकिन एक important difference है — index matching! |
Sir ने दो Series बनाई —
|
>>> seriesA = pd.Series([1,2,3,4,5], index=[‘a’,’b’,’c’,’d’,’e’]) >>> seriesB = pd.Series([10,20,-10,-50,100], index=[‘a’,’b’,’y’,’n’,’c’]) |
|
Sir: अब जब इन दोनों को add करेंगे — Pandas पहले indexes match करेगा। जो index दोनों में हो, वहाँ addition होगी। जो किसी एक में न हो — वहाँ result NaN आएगा। |
|
Rahul: NaN मतलब? (puzzled face) |
|
Sir: NaN = Not a Number. मतलब value missing है। जब कोई corresponding value न मिले दोनों series में, तो result NaN रखता है Pandas. |
[ *Everyone writes NaN in their notes with a circle around it* 😄 ]
(A) Addition —
|
>>> seriesA + seriesB a 11.0 b 22.0 c NaN # 3 + ? — ‘c’ only in seriesA index-wise mismatch … dtype: float64 |
|
Sir: NaN avoid करना हो तो .add() method use करो और fill_value parameter दो — |
|
>>> seriesA.add(seriesB, fill_value=0) a 11.0 b 22.0 c 3.0 # missing value replaced with 0 dtype: float64 |
(B) Subtraction, (C) Multiplication, (D) Division — same way, दो methods:
- Operator use करो → seriesA – seriesB / seriesA * seriesB / seriesA / seriesB
- Method use करो → seriesA.sub(seriesB, fill_value=0) / .mul() / .div()
📋 2.3 — DataFrame
2D table — rows और columns दोनों!
Sir ने board पर एक simple table बनाई —
|
Sir: कभी-कभी हमें एक time पर कई columns के साथ काम करना होता है — restaurant का menu, exam results, किसी team का data. यह सब tabular data है। इसके लिए Pandas में DataFrame है। |
Sir, you are reading the Data Handling Using Pandas 1 NCERT solutions in English PDF. It contains all the code examples and back-exercise solutions in English. It would help you in the board Exam
|
Sir: DataFrame एक 2-dimensional labelled structure है — spreadsheet जैसा। इसमें rows और columns दोनों होते हैं। हर column एक Series होती है। |
🛠️ 2.3.1 — DataFrame बनाने के तरीके
Multiple ways to create a DataFrame
(A) Empty DataFrame —
|
>>> import pandas as pd >>> dFrameEmpty = pd.DataFrame() >>> dFrameEmpty Empty DataFrame Columns: [] Index: [] |
(B) NumPy Arrays से —
|
>>> import numpy as np >>> array1 = np.array([10,20,30]) >>> dFrame4 = pd.DataFrame(array1) >>> dFrame4 0 0 10 1 20 2 30 |
|
Sir: Multiple arrays से DataFrame बनाते वक्त columns parameter देना जरूरी है — |
|
>>> dFrame5 = pd.DataFrame([array1, array2, array3], columns=[‘A’,’B’,’C’,’D’]) A B C D 0 10 30 NaN NaN 1 -10 -20 30 40.0 2 100 200 300 40 |
(C) List of Dictionaries से —
|
Sir: Dictionary में keys बन जाती हैं column labels और values बन जाती हैं rows. Dictionary की count = rows की count. |
Here you are reading
|
>>> listDict = [{‘a’:10,’b’:20},{‘a’:5,’b’:10,’c’:20}] >>> dFrameListDict = pd.DataFrame(listDict) a b c 0 10 20 NaN 1 5 10 20.0 |
(D) Dictionary of Lists से —
|
>>> dictForest = {‘State’:[‘Assam’,’Delhi’,’Kerala’], … ‘GArea’:[78438,1483,38852], … ‘VDF’:[2797,6.72,1663]} >>> dFrameForest = pd.DataFrame(dictForest) State GArea VDF 0 Assam 78438 2797.00 1 Delhi 1483 6.72 2 Kerala 38852 1663.00 |
(E) Dictionary of Series से — यह सबसे common method है exam में:
|
>>> seriesA = pd.Series([1,2,3,4,5], index=[‘a’,’b’,’c’,’d’,’e’]) >>> seriesB = pd.Series([1000,2000,-1000,-5000,1000], … index=[‘a’,’b’,’c’,’d’,’e’]) >>> dFrame6 = pd.DataFrame(seriesA) 0 a 1 b 2 … |
Multiple series pass करने पर —
|
>>> dFrame7 = pd.DataFrame([seriesA, seriesB]) a b c d e 0 1 2 3 4 5 1 1000 2000 -1000 -5000 1000 |
✂️ 2.3.2 — DataFrame पर Operations
Add, Delete, Rename — rows और columns
Sir ने ResultDF नाम का एक DataFrame बनाया — students के marks का:
|
>>> Arnab = pd.Series([90,92,97], index=[‘Maths’,’Science’,’Hindi’]) >>> Ramit = pd.Series([82,81,90], index=[‘Maths’,’Science’,’Hindi’]) >>> Samidhi= pd.Series([88,81,71], index=[‘Maths’,’Science’,’Hindi’]) >>> Riya = pd.Series([81,71,95], index=[‘Maths’,’Science’,’Hindi’]) >>> Malika = pd.Series([94,95,99], index=[‘Maths’,’Science’,’Hindi’]) >>> ResultDF = pd.DataFrame({‘Arnab’:Arnab,’Ramit’:Ramit, … ‘Samidhi’:Samidhi,’Riya’:Riya,’Malika’:Malika}) |
(A) नया Column add करना —
|
>>> ResultDF[‘Preeti’] = [85,79,76] # अब Preeti का column add हो गया |
|
Sir: अगर column पहले से exist करता है, तो assignment उसे update करेगी — नया नहीं बनेगा। |
(B) नई Row add करना — .loc[] से:
|
>>> ResultDF.loc[‘English’] = [85,85,85,80,85,89] # English का row add हो गया |
|
Sonal: Sir, अगर values की count columns से कम हो तो? |
|
Sir: ValueError आएगी — mismatch columns बोलेगा. Values की count exactly columns के बराबर होनी चाहिए. |
(C) Rows/Columns delete करना — .drop() से:
|
>>> ResultDF = ResultDF.drop(‘Science’, axis=0) # row delete >>> ResultDF = ResultDF.drop([‘Samidhi’,’Riya’], axis=0) # multiple rows >>> ResultDF = ResultDF.drop(‘Arnab’, axis=1) # column delete |
|
Sir: axis=0 मतलब row, axis=1 मतलब column. यह याद रखना — exam में पूछते हैं! |
[ *students highlight this in their notes* ✏️ ]
(D) Renaming — .rename() से:
|
>>> ResultDF=ResultDF.rename({‘Maths’:’Sub1′,’Science’:’Sub2′,’English’:’Sub3′}, … axis=’index’) # Row labels rename हो गए >>> ResultDF=ResultDF.rename({‘Arnab’:’Student1′,’Ramit’:’Student2′}, … axis=’columns’) # Column labels rename |
🔎 2.3.3 — DataFrame Elements Access करना
Label-Based and Boolean Indexing
Sir ने समझाया —
|
Sir: DataFrame में access के लिए .loc[] सबसे important है — label based indexing. इसे याद कर लो। Row label दो तो Series मिलती है, column label दो तो column मिलती है। |
(A) Label Based Indexing — .loc[] :
|
>>> ResultDF.loc[‘Science’] # एक row Arnab 91 Ramit 81 … Name: Science, dtype: int64 >>> print(df[‘Arnab’]) # एक column Maths 90 Science 91 Hindi 97 Name: Arnab, dtype: int64 |
|
>>> ResultDF.loc[[‘Science’,’Hindi’]] # multiple rows >>> ResultDF.loc[‘Maths’:’Science’,’Arnab’] # row slice + single column >>> ResultDF.loc[‘Maths’:’Science’,[‘Arnab’,’Samidhi’]] # row+col slice |
(B) Boolean Indexing — conditions से filtering:
|
Sir: Boolean indexing में हम एक condition लगाते हैं — जो rows उस condition को satisfy करें वो True, बाकी False. और True वाली rows ही display होती हैं। |
|
>>> ResultDF.loc[‘Maths’] > 90 Arnab True Ramit False Samidhi False Riya False Malika True Name: Maths, dtype: bool >>> ResultDF.loc[ResultDF.loc[‘Maths’] > 90] # Arnab और Malika के columns दिखाएगा |
Slicing in DataFrame —
|
>>> ResultDF.loc[‘Maths’:’Science’] # rows slice with labels >>> ResultDF.loc[‘Maths’:’Science’,’Arnab’] # rows + single column |
Data handling using pandas 1 ncert solutions pdf download Audio Notes 3
2.3.5 — Joining, Merging & Concatenation
DataFrames को जोड़ना
|
Sir: Sometimes हमारे पास data दो अलग DataFrames में होता है — और हमें उन्हें जोड़ना होता है। इसके लिए pd.concat() method use करते हैं। |
|
>>> dFrame1 = pd.DataFrame([[1,2,3],[4,5,6]], columns=[‘C1′,’C2′,’C3’], index=[‘R1′,’R2’]) >>> dFrame2 = pd.DataFrame([[10,20],[40,50]], columns=[‘C2′,’C3’], index=[‘R4′,’R2’]) >>> dFrame1.append(dFrame2) C1 C2 C3 R1 1.0 2.0 3.0 R2 4.0 5.0 6.0 R4 NaN 10.0 20.0 R2 NaN 40.0 50.0 |
|
Sir: Missing column का data NaN आता है. sort=True देने पर columns sorted order में आते हैं। |
📐 2.3.6 — DataFrame के Attributes
shape, size, dtypes, etc.
|
Attribute |
क्या करता है |
Example result |
|---|---|---|
|
.index |
Row labels show करता है |
RangeIndex(start=0, stop=4) |
|
.columns |
Column labels |
Index([‘Assam’,’Kerala’,’Delhi’]) |
|
.dtypes |
हर column का data type |
State: object, GArea: int64 |
|
.values |
सारा data NumPy array में |
array([[…],[…]]) |
|
.shape |
(rows, columns) tuple |
(4, 3) — 4 rows, 3 columns |
|
.size |
Total elements |
12 — rows × columns |
|
.T |
Transpose — rows↔columns बदल देता है |
columns become rows |
|
.head(n) |
पहले n rows दिखाता है |
Default n=5 |
|
.tail(n) |
आखिरी n rows |
Default n=5 |
|
.empty |
Empty है? True/False |
False |
📁 2.4 — CSV Files और DataFrames
Import करना, Export करना
|
Sir: Real life में data हमें files में मिलता है — Excel, CSV वगैरह. Pandas में CSV file से directly DataFrame बना सकते हैं। |
2.4.1 — CSV file को DataFrame में Import करना:
|
>>> marks = pd.read_csv(‘C:/NCERT/ResultData.csv’, sep=’,’) >>> marks RollNo Name Eco Maths 0 1 Arnab 18 57 1 2 Kritika 23 45 … |
- First parameter — CSV file का path
- sep — separator character (default comma)
- header — row number जहाँ से data start हो (default 0)
- names — custom column names देने के लिए
2.4.2 — DataFrame को CSV में Export करना:
|
>>> ResultDF.to_csv(‘C:/NCERT/ResultData.csv’, sep=’,’) # यह ResultData.csv नाम की file create करेगा >>> ResultDF.to_csv(‘C:/NCERT/resultsonly.txt’, sep=’#’, header=False, index=False) # header=False — column names नहीं लिखेगा # index=False — row labels नहीं लिखेगा |
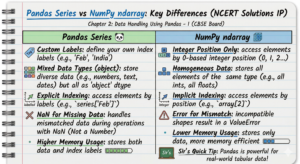
⚖️ 2.5 — Pandas Series vs NumPy ndarray
Key Differences
|
Pandas Series |
NumPy ndarray |
|---|---|
|
Custom labels define कर सकते हैं |
Integer position से ही access होता है |
|
Descending order में index हो सकता है |
Index 0 से start, fixed |
|
Unaligned Series में NaN आता है |
Mismatch पर error आता है |
|
ज़्यादा memory use होती है |
NumPy comparatively कम memory लेता है |
⚡ Quick Revision — Chapter 2 Key Points
Exam से पहले यह ज़रूर पढ़ो!
- Pandas की तीन main libraries: NumPy, Pandas, Matplotlib
- Series = 1D, DataFrame = 2D. दोनों को use करने से पहले import pandas as pd लिखना जरूरी।
- Positional slicing में end exclude होता है, Labelled slicing में end include होता है।
- Math operations में index match होती है — mismatch पर NaN आता है। fill_value से NaN avoid करो।
- DataFrame में axis=0 → row, axis=1 → column. drop(), rename(), loc[] — exam favorites!
- CSV import: pd.read_csv() / CSV export: to_csv() — parameters: sep, header, index, names.
- Pandas Series में custom labels होते हैं, NumPy में integer position — यही main difference है।
Bell बजने वाली है — Sir का last line:
“Pandas सीखना मतलब data को समझना सीखना।
जितना practice करोगे, उतना clearly data तुमसे बात करेगा।”
Study Material & Solutions
अगर आप इस चैप्टर के नोट्स और सॉल्यूशंस को सेव करना चाहते हैं, तो नीचे दिए गए लिंक्स का उपयोग करें:
-
For English Medium Students: Click here to get Data Handling Using Pandas 1 ncert solutions English pdf download. It contains all the code examples and back-exercise solutions in English.
-
हिंदी माध्यम के छात्रों के लिए: यहाँ से आप Data Handling Using Pandas 1 ncert Solutions Hindi pdf download कर सकते हैं। इसमें हमने क्लासरूम की भाषा (सरल हिंदी) में पूरे चैप्टर को समझाया है।
2. “Classroom Story” में इनका उपयोग
आपकी कहानी में Sir और Rahul/Neha के बीच एक छोटा संवाद जोड़ सकते हैं जो इन कीवर्ड्स को नेचुरल बना देगा:
Neha: “Sir, क्या ये नोट्स हमें PDF में मिल सकते हैं? एग्जाम्स के लिए रिवीजन आसान हो जाएगा।” Sir: “बिल्कुल Neha! मैंने Data handling using pandas 1 ncert solutions Hindi pdf download और English pdf download दोनों के लिंक वेबसाइट पर डाल दिए हैं। तुम अपनी पसंद की भाषा में नोट्स पढ़ सकती हो।”
NCERT Class 12 Informatics Practices | Chapter 2 | CBSE Board
Data handling using pandas 1 ncert solutions English pdf download
Data handling using pandas 1 ncert solutions Hindi pdf download